|
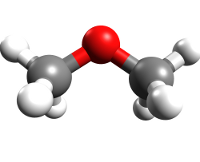
The molecule displays internal rotation of the two
non-equivalent methyl groups. The experimental data were
reproduced quite well with the erham program.
The present analysis is based on the data from
(1) M. Koerber, S. E. Bisschop, C. P. Endres, M. Kleshcheva,
R. W. H. Pohl, A. Klein, F. Lewen, and S. Schlemmer,
2013, Astron. Astrophys. 558, Art. No. A112.
The data are predominantly from that study. Some of the lower
frequency data were taken from
(2) Y. Niide, and M. Hayashi,
2003, J. Mol. Spectrosc. 220, 65.
The calculations should be sufficiently accurate for all
observational purposes. Transitions with calculated uncertainties
exceeding 0.1 MHz should be viewed with some caution. Please
note that the merged transitions refer to measured transition
frequencies, but the uncertainties are the calculated ones.
Please note also that erham uses two σ values to label
each symmetry component. This is incompatible with the VAMDC-CDMS
requirements and does not agree with the convention of the
classical CDMS to use one state number to label
one symmetry species (or one vibrational state etc.).
The following relations exist:
0 / 0 0 / A / AA,
1 / 0 1 / E1 / EA,
2 / 1 0 / E2 / AE,
3 / 1 1 / E3 / EE1,
4 / 1 2 / E4 / EE2.
Please note also that the partition function refers to
the ground vibrational state.
Vibrational correction factors for a posteriori corrections
will be available in the future.
The dipole moment was assumed to be the same as for
the main isotopic species which was determined by
(3) U. Blukis, R. J. Myers, and P. H. Kasai,
1963, J. Chem. Phys. 38, 2753.
|
