Example Nitryl Chloride, ClNO2
Fermi resonance between n1
and 2n6
The experimental lines were kindly provided by Dr. Johannes Orphal,
Paris, France; see the article
"The n1 and 2n6
bands of 35ClNO2 (nitryl chloride) around 7.7mm
studied by high-resolution Fourier-transform spectroscopy"
by J. Orphal, G. Guelachvili, and M. Morillonchapey
published in J. Mol. Spectrosc.
166 (1994) 280–286.
Data of the ground vibrational level were obtained from a combined fit
of several vibrational bands and 25 pure rotational transitions and were
kept fixed in this analysis. The parameters determined for the upper
states are the changes to those of the ground vibrational state.
The Fermi resonance term could not be determined independent of the
other spectroscopic parameters. Thus, its value was calculated in the article mentioned above
by assuming 2n6 had no intensity in
the absence of the Fermi resonance. In the present analysis, its value
was slightly adjusted to reduce the standard deviation of the fit.
Note: There are different conventions
for giving the magnitude of the Fermi interaction term, usually differing
by the square root of 2. The unperturbed energies determined for n1
and 2n6 are 1282.43 and 1304.61 cm–1,
respectively, and 22.99 cm–1 is the value of the
Fermi interaction constant.
The files provided are:
- The parameter file.
- The file with the experimental lines.
- The fit file which shows the result of the
fit, including spectroscopic constants, their uncertainties, correlation
coefficients and the residuals between observed and calculated
frequencies.
- The variance file for predicting the
spectrum.
- The intensity file also needed for predicting the
spectrum. It has the transition dipole moment(s), quantum number limits etc.
- I almost forgot ! The energy file is really useful in this context.
It shows the energy levels with uncertainties and mixing coefficients !
Ooohh !!
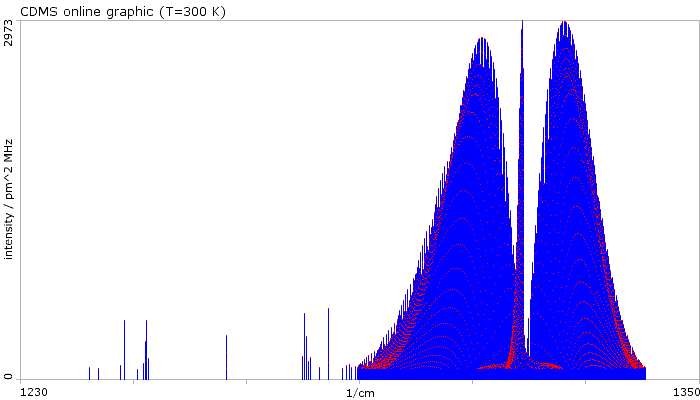
Figure 1 shows a simulation of the
bands assuming a zero transition dipole moment for 2
n6.
Note: the intensity cut-off is clearly visible in order to keep the
files comparatively small.
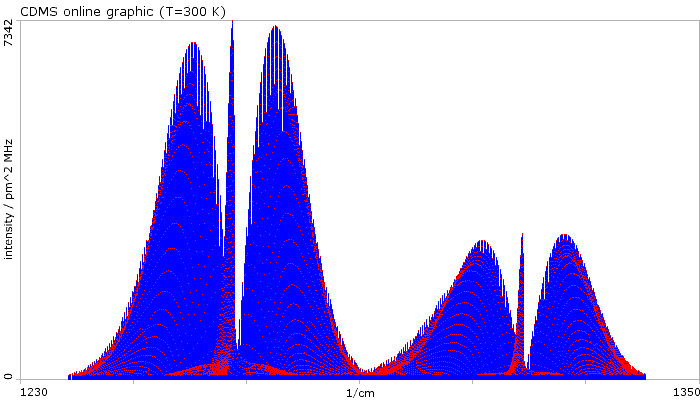
Figure 2 shows a simulation of the
n1 band.
Some perturbation enhanced transitions with
DKa = 4 can be seen.
Because of the density of lines they probably can be found only in a
double resonance experiment. It should also be kept in mind that the
intensity and exact position of the lines is model dependent !
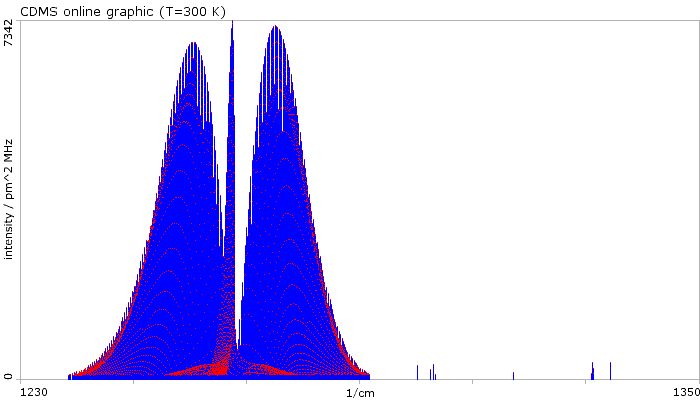
Figure 3 shows the same for
2
n6.